Relations
Definitions and terminology
- A relation between two variables always starts at some variable and ends at another.
- The set of valid values at the start of a relation is called the domain.
- For simplicity, the set of valid values at the end of a relation will be called the range.
Representation
Mapping diagrams
These look like Venn diagrams, with two sets represented by two (usually oval) shapes; one representing the domain, and the other the range. Arrows go from elements in the domain to elements in the range. We say that elements in the domain are mapped (i.e., related) to elements in the range.
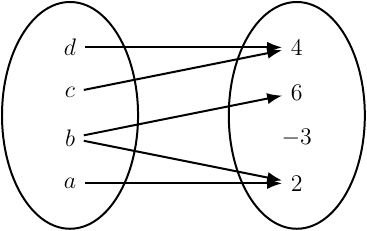
In the diagram above, the set \(\{d,c,b,a\}\) (where arrows start) is the domain of the relation, and the set \(\{4,6,-3,2\}\) (where arrows end) is the range. Element \(d\) is mapped to \(4\), element \(c\) is also mapped to \(4\), element \(b\) is mapped to both \(6\) and \(2\), and element \(a\) is mapped to \(2\).
Ordered pairs
An ordered pair is a pair of elements written between parentheses, and the order in which elements are written conveys certain information. When we represent a relation as ordered pairs, the first element is the one that belongs to the domain, and the second is the one that belongs to the range. The relation in the previous mapping diagram can be represented as the following set
\[\{(d,4),(c,4),(b,6),(b,2),(a,2)\}\]Notice that each arrow in the mapping diagram corresponds to an ordered pair. Also notice that \(-3\) in the range does not appear in the ordered pairs. We can simply omit it because there is no arrow attached to it.
Tabular format
We can also represent a relation as a table of two columns (or two rows). The first column (or row) has elements from the domain, and the second column (or row) has elements from the range. The relation in the mapping diagram above can be represented as a table of two columns like the following.
| Domain | Range |
|---|---|
| \(d\) | \(4\) |
| \(c\) | \(4\) |
| \(b\) | \(6\) |
| \(b\) | \(2\) |
| \(a\) | \(2\) |
It can also be represented as a table of two rows like the following. Notice that the tabular format is essentially writing the ordered pairs in the form of a table.
| Domain | \(d\) | \(c\) | \(b\) | \(b\) | \(a\) |
|---|---|---|---|---|---|
| Range | \(4\) | \(4\) | \(6\) | \(2\) | \(2\) |
Graphical representation
In this method, we represent the domain of the relation on the horizontal axis, and the range on the vertical axis. We place a point on the plane for each ordered pair (i.e., each arrow in the mapping diagram). Each point is on a vertical line that passes through the element from the domain, and on a horizontal line that passes through the element from the range.
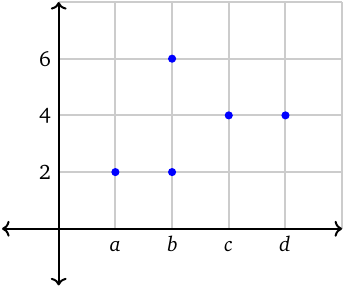
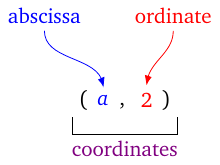
In this representation, we typically call the elements in the ordered pairs coordinates. The first element is called the abscissa or the \(\boldsymbol{x}\)-coordinate, and the second is called the ordinate or the \(\boldsymbol{y}\)-coordinate. We call the horizontal axis the \(\boldsymbol{x}\)-axis or the axis of abscissas, and the vertical axis the \(\boldsymbol{y}\)-axis or the axis of ordinates.
When using numerical values, the two axes cross each other at the zero value on each axis. This point with coordinates \((0,0)\) is called the origin of coordinates. The whole system is called a Cartesian axial system, after the French mathematician ‘René Descartes’.
Algebraic representation
If the relation is between two numeric variables, we may be able to find an equation that relates their values. Although this is only one form of representing equations, it is of particular importance because we can use algebra to handle relations.